

Seattle Parks and Recreation — Rec N' The Streets
Recreation programming and neighborhood violent incidents
A case study in method: what was asked, what evidence was available, how it was analyzed, and what the result can and cannot establish.
The question
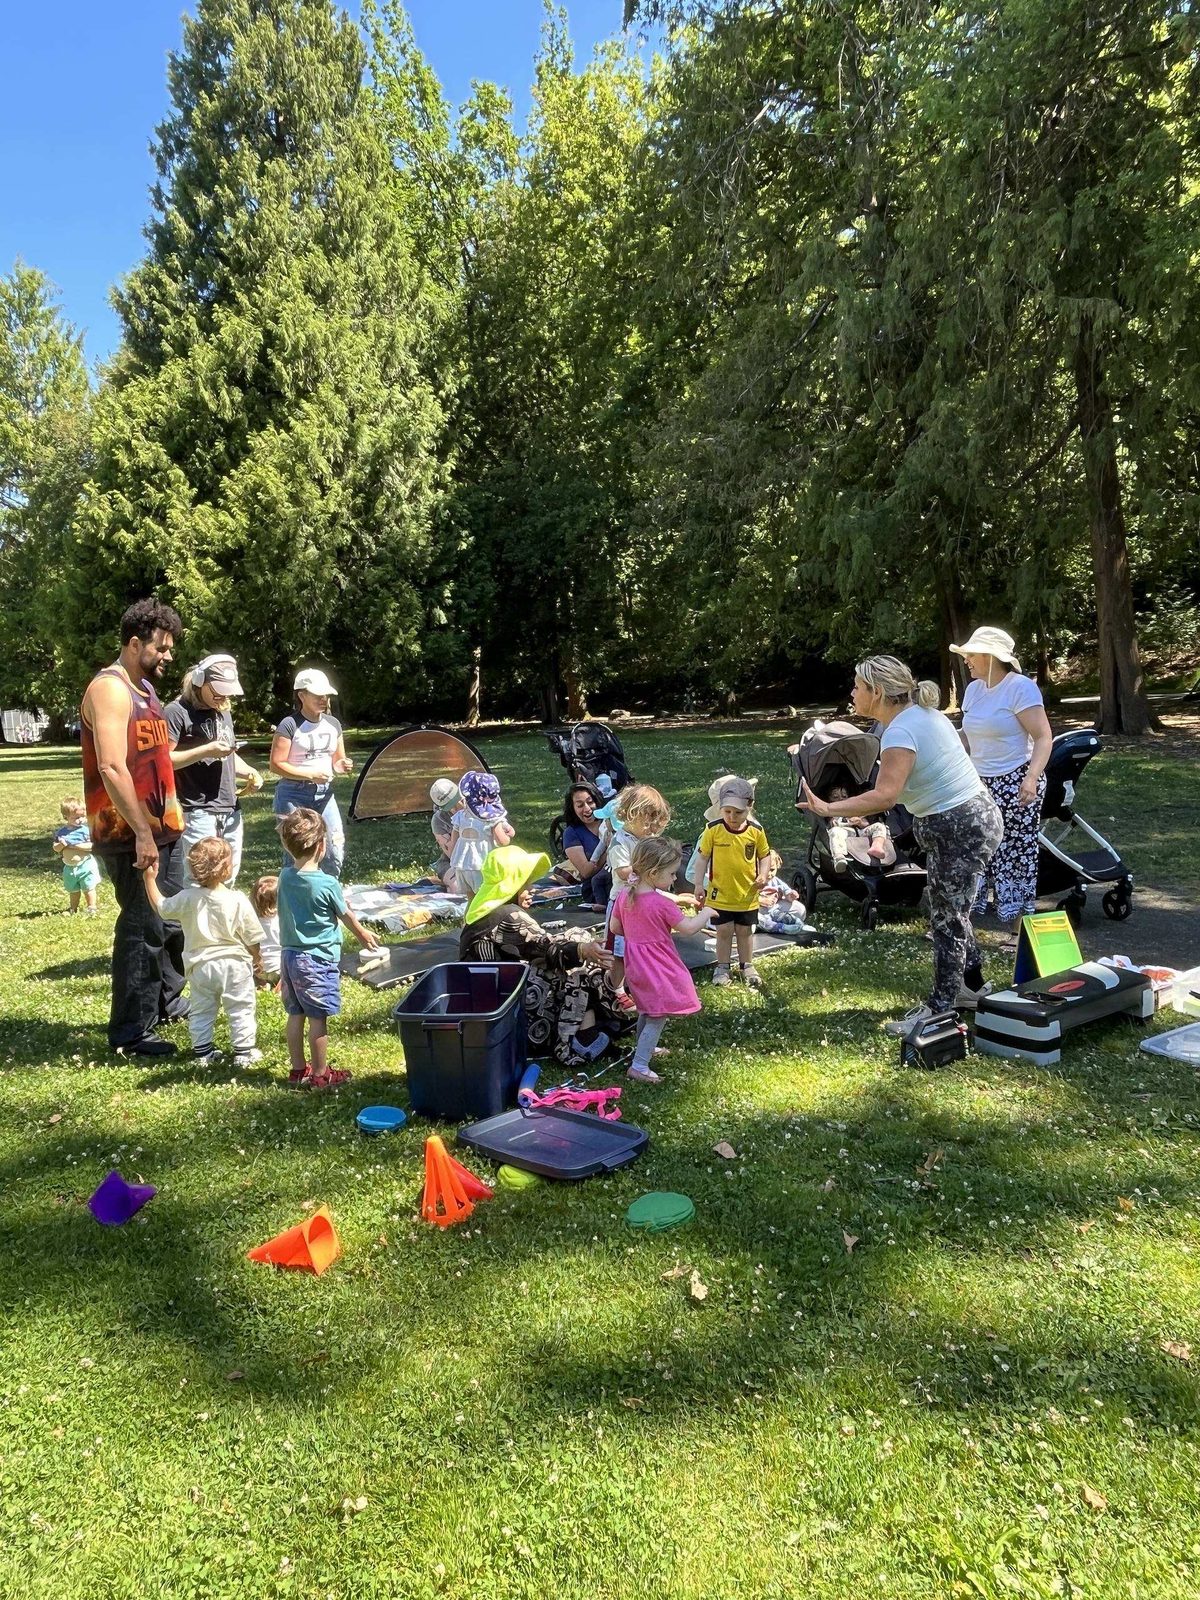
Rec N' The Streets is a mobile program that brings sports, fitness, arts and youth activities into Seattle parks in historically underserved neighborhoods. Its stated purpose is to activate public space that is otherwise underused — the logic being that more legitimate use of a park means more people present, more informal guardianship, and fewer opportunities for violence.
The question was whether that shows up in the data: does violent crime in a park fall during the seasons RNTS is running there?
The evidence available
- Incident-level violent crime records from the Seattle Police Department, with timestamps and coordinates.
- RNTS deployment records from Seattle Parks and Recreation schedules and internal program data.
- 2020 through 2025, divided into four seasons per year.
- Roughly twenty park clusters.
Crimes were matched to parks within a 100-meter buffer and aggregated to park-season-year. Both sources already existed; nothing new had to be collected.
Method
The outcome is not the raw crime count but the year-over-year change — each park-season compared against the same season a year earlier. That construction removes persistent seasonal patterns before estimation begins.
The model is a two-way fixed-effects panel specification with park and season fixed effects, so the comparison is within the same park over time rather than between different parks. Because RNTS exposure varies across park-seasons rather than starting at one common date, it functions as a generalized difference-in-differences design with staggered treatment.
Inference used a wild cluster bootstrap. With roughly twenty clusters, conventional clustered standard errors are unreliable and would have overstated precision. A secondary signed-log specification tested whether RNTS is associated with broader downward movement in crime dynamics, not just the level change; it returned the same direction and significance.
Principal finding
0.49
fewer violent incidents per activated park-season, relative to comparable unactivated park-seasons.
What it is worth
An effect size means little to a budget committee without a denominator and a price. The average treated park carries roughly 0.63 violent incidents per season, so an effect of 0.49 removes a large share of the violent crime that park would otherwise see while programming runs.
Scaled across the program and costed at prevailing policing and incident-response rates, the avoided enforcement burden looks like this:
| Effect per activated park-season | 0.49 incidents |
| Activations per year | ~176 |
| Violent incidents prevented annually | ~85 |
| Cost per violent incident | ~$15,000 |
| SPD response expenditure abated annually | ~$1.27 million |
This is cost avoidance, not recovered cash: it is expenditure the department does not have to make, built on a per-incident cost drawn from the cost-of-crime literature rather than an audited budget line. Stated that way it survives scrutiny; stated as savings it would not.
Beyond levels: volatility
The signed-log specification tests whether RNTS changes crime dynamics rather than only crime counts. It returns a statistically significant reduction in fluctuation — roughly −0.215 — meaning activation dampens increases when crime is rising and reinforces declines when it is falling.
For an operations manager this is the more useful half of the result. Predictable conditions are easier to staff than favorable ones, and a park that does not spike is a park that does not consume unplanned response capacity.
What it establishes, and what it does not
Because identification comes from within-park variation while programming is active, the estimate describes the short run — what happens during a treated park-season. It is not evidence of a permanent effect that persists once programming stops.
RNTS sites were not randomly assigned. Placement followed programmatic and operational decisions and may favour parks with higher baseline crime. Fixed effects and year-over-year differencing reduce that concern without eliminating it.
The dataset may underrepresent park-seasons with no reported crime, which would tilt the sample toward higher-activity parks. Spatial assignment by proximity introduces some measurement error. And reported incidents record what was reported, not everything that occurred.
What it supports deciding
Where to concentrate limited seasonal programming capacity, and how to describe recreation's role in prevention and community infrastructure when that case has to be made to funders, policymakers, and council committees.
Prepared for Seattle Parks and Recreation's Outdoor Activation and Mobile Recreation program by Benjamin Scott, with methodological feedback from Dr. Plakias, Western Washington University, and research support from Edict Economics. Produced in the course of employment rather than as a commissioned consulting engagement; Seattle Parks and Recreation has not reviewed or endorsed this page, which is presented to show method and reasoning.
The condensed decision-maker version of this analysis is available as a policy brief: The Public Safety Impact of Rec N’ The Streets (PDF).
Have a question like this one?
If you are wondering whether your own data can answer the question you are being asked, that is a useful first conversation.
Discuss your program